System Design Drill Day 5: Load Balancing and Horizontal Scaling
How to go from one Laravel server to three behind a load balancer: algorithms, health checks, stateless servers and safe deploys.
You add a second app server before a big sale. Users start getting logged out at random, product images show up for some people and not others, and the daily report email arrives twice. The code didn't change; there's simply more than one box now.
Day 4 took read pressure off the database, and the app tier needs the same treatment. This drill takes an online marketplace from one Laravel server to three behind a load balancer and goes through what breaks on the way, which is mostly state.
Core concepts
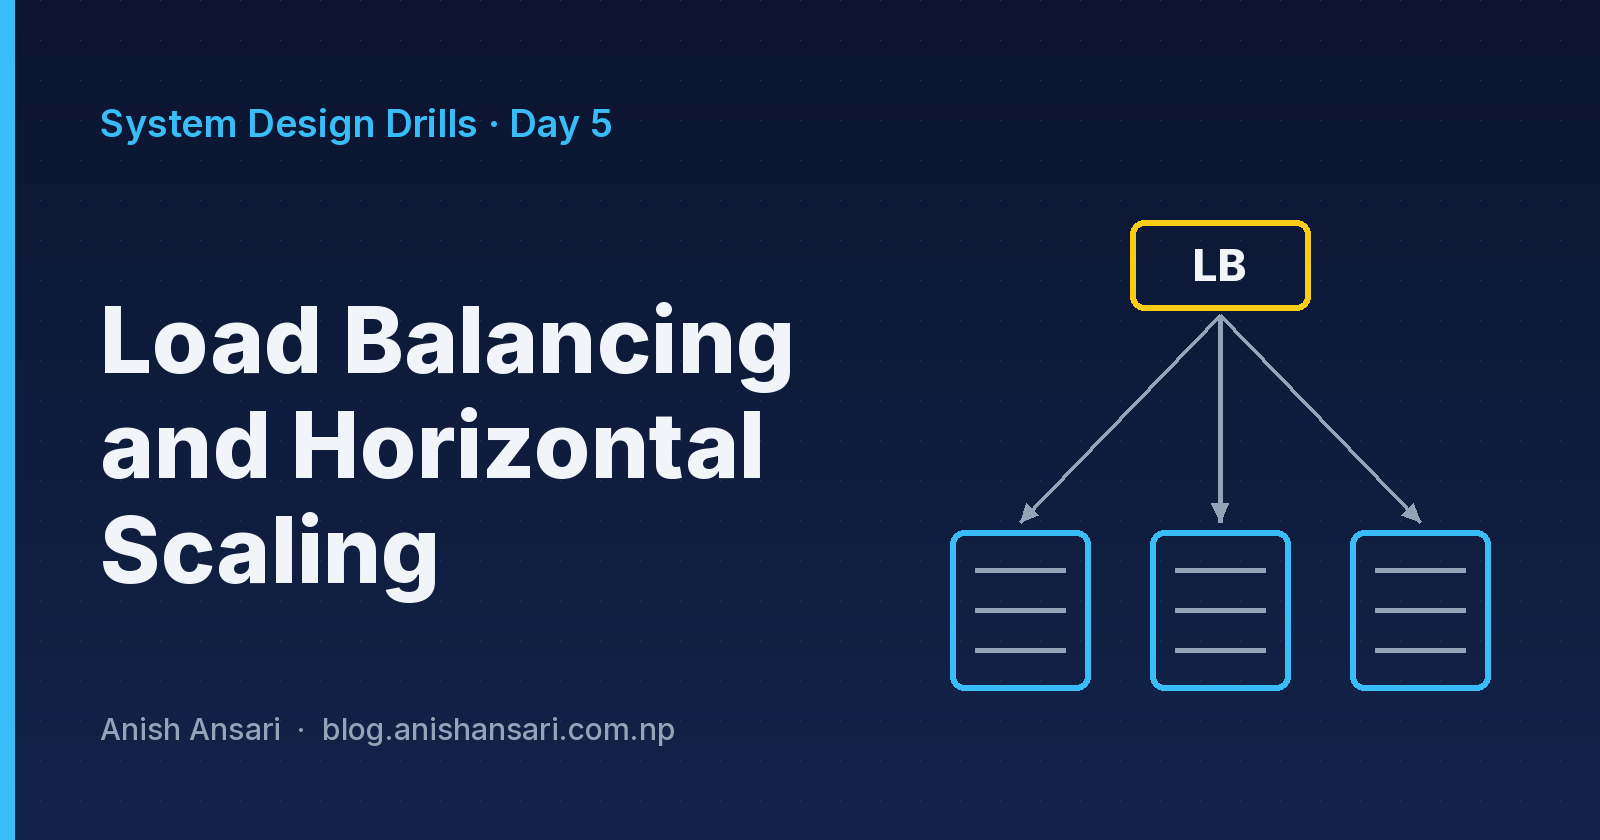
When one server gets slow, the first instinct is to buy a bigger one. That's vertical scaling, and it works until you hit the ceiling or the bill. The alternative is several identical boxes with a load balancer (LB) in front spreading requests between them, which is horizontal scaling.
An L4 balancer routes on IP and port. It's fast but can't see inside the request. An L7 balancer understands HTTP, so it can route by path or header, terminate TLS and add headers like X-Forwarded-For. Nginx and HAProxy can run at either layer, and together with AWS ALB they can all run at L7, which is what a Laravel app normally sits behind.
Round robin, the default, hands requests to servers in turn. Least-connections picks the least busy server, which works better when request times vary a lot. IP-hash or consistent hashing keeps a client on the same server.
The LB also needs to know which servers can take traffic. It probes each one on a readiness endpoint, /health/ready from Day 1, and stops routing to any that return 503. A separate liveness check, /health/live, only answers "is the process up?" and is what a process supervisor uses to restart a dead process. Keep the two apart, and keep shared optional dependencies out of readiness, or one Redis blip marks every server unready at once.
The rule underneath all of this is that any server must be able to handle any request. Whatever lives on a single box, such as sessions, uploaded files, an in-memory cache or a cron job, breaks as soon as a second box appears. Sticky sessions, which pin each user to one server, hide the problem for a while, but load becomes uneven and users get logged out when their server dies. In an interview, the expected answer is to make the servers stateless.
The LB itself can also be a single point of failure, so run a redundant pair or use a managed one.
Pause and think: You add a second server and users start getting logged out at random. Sessions are already in Redis. What did you most likely forget?
Answer:
APP_KEY. If it's different on each server, a cookie encrypted by one box can't be decrypted by the other, so the session looks invalid.
The design problem
The marketplace runs on one Laravel server and a big sale is coming. Add an LB and go to 3 app servers, using the primary plus replicas from Day 4 and Redis. Draw the request path and list every change.
Afterwards, a logged-in user must stay logged in whichever server answers, and product images uploaded in the admin must show up for everyone. php artisan schedule:run must not send three copies of the daily report email, deploys must not drop requests mid-checkout, and losing one server mid-sale should barely be noticeable.
Try the problem before reading the solution.
Questions to think about
- Why is stateless better than sticky sessions, and when is stickiness acceptable?
- What should the LB health check test, and what goes wrong if it checks a shared dependency like Redis?
- Round robin or least-connections for this marketplace, and why?
Model solution
The request path ends at 3 identical Laravel servers, all talking to the MySQL primary and replicas, Redis, and object storage.
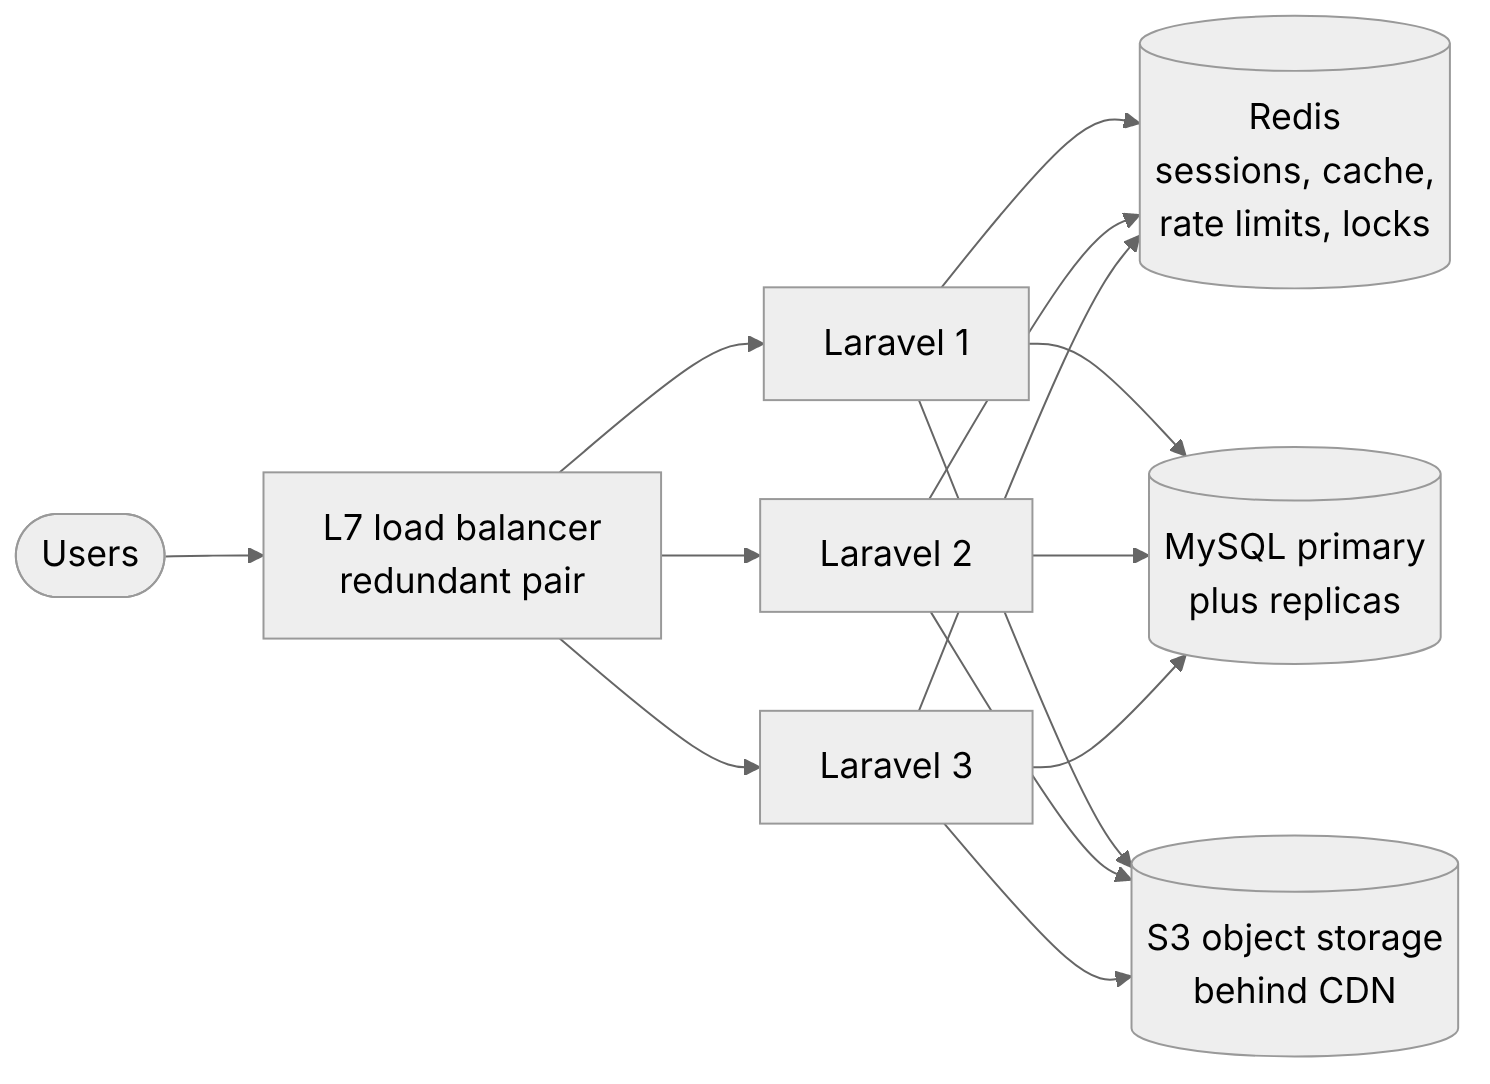
Figure 1: Three stateless app servers. Everything that used to live on one box now lives in a shared store.
Set SESSION_DRIVER=redis (or database) so all servers share one session store. APP_KEY must be identical on all three, or cookies encrypted on one box won't decrypt on another. With that done, stickiness isn't needed.
Uploads go to S3 or an S3-compatible store (FILESYSTEM_DISK=s3) behind a CDN. User files should never be written to storage/app on a single box, where only a third of requests would find them.
For the scheduler, add ->onOneServer(), which takes a lock in Redis so only one box runs each task, or run the scheduler on a dedicated worker box. Use ->withoutOverlapping() for long tasks. Queue workers can run anywhere, because Redis hands each job to one worker at a time, with redelivery if that worker fails (at-least-once), and the Day 3 idempotency checks cover the rare repeat.
Deploys roll one server at a time: take it out of the LB, deploy, warm it up, put it back, move to the next. Connection draining lets in-flight checkouts finish. Migrations must be backward-compatible (add columns first, drop them later), since old and new code run side by side during the roll.
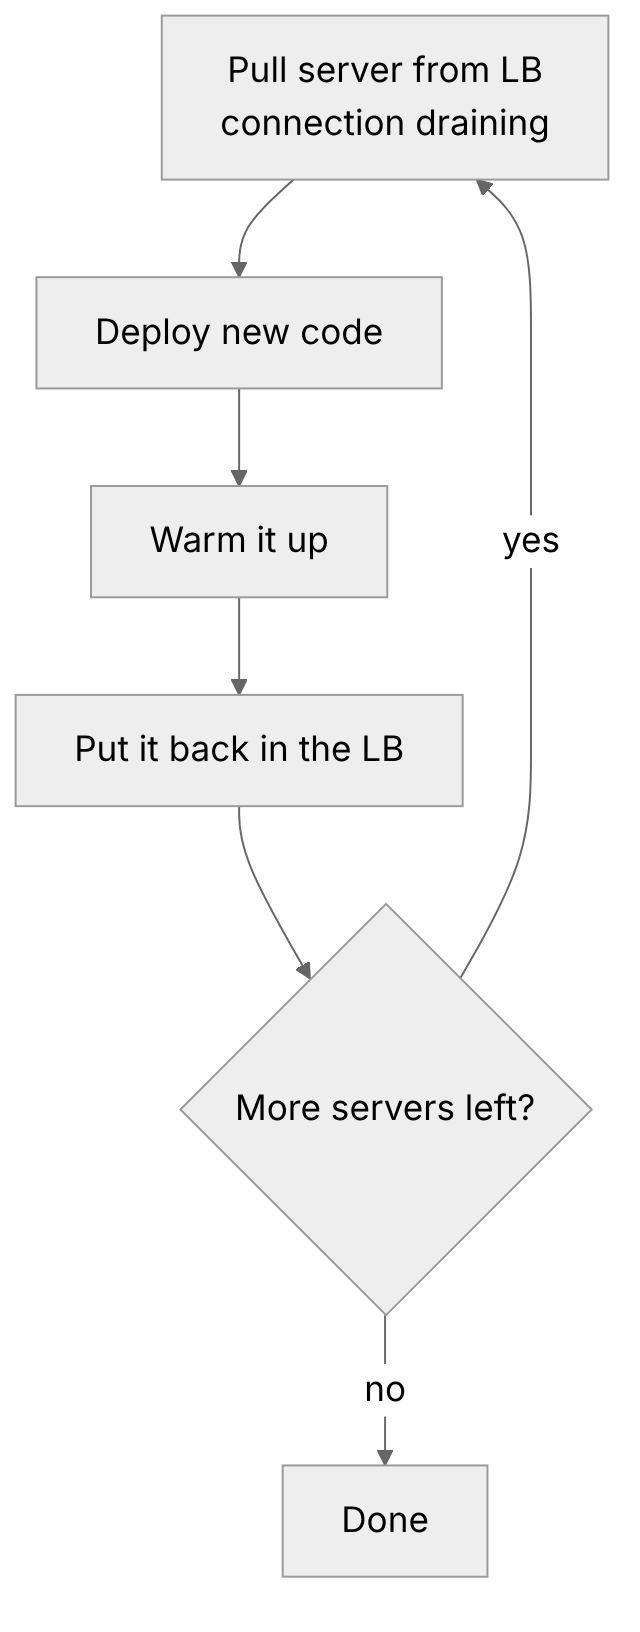
Figure 2: A rolling deploy, one server at a time, with draining so no checkout gets cut off.
If a server dies mid-sale, failing readiness probes take it out of rotation within seconds. Plan capacity for N+1, so two servers can carry the peak if one dies, and make the LB redundant. Retries on idempotent requests, together with the checkout idempotency keys from Day 3, cover requests cut off mid-flight.
A few smaller details still matter. Configure TrustProxies so Laravel sees the real client IP and the HTTPS scheme. Keep cache and rate-limiter state in Redis so limits are shared, and ship logs to one central place instead of leaving them on each server.
Answers to the questions
- Stateless servers can come and go freely: load stays even, and a dead server doesn't log anyone out. I'd only accept stickiness for things like WebSockets, or a legacy app you can't change yet.
- The LB should route on readiness, which checks the dependencies this instance needs, with timeouts. Liveness stays cheap and is for restarts, not routing. Never fail every server because of one shared dependency. When every target is unhealthy, many LBs "fail open" and send traffic everywhere anyway, so you gained nothing.
- Least-connections, because checkout and search requests take very different amounts of time here. Round robin is fine when requests are roughly uniform.
Interview one-liner
"Make the app tier stateless: sessions, cache and rate limits in Redis, files in object storage, scheduled tasks on one server, then put a redundant L7 load balancer with separate liveness and readiness checks in front and roll deploys one server at a time."
Conclusion
Horizontal scaling only works once every piece of per-box state has a shared home, so find the state before adding servers. Watch the readiness check in particular: if it fails on a dependency all servers share, the load balancer can empty the whole pool at once.
Try it yourself
Run two copies of a Laravel app locally on different ports, put a small Nginx upstream with both in front, and log in. Refresh a few times; with sessions on the file driver, the logouts appear right away.
Switch to SESSION_DRIVER=redis with the same APP_KEY on both and try again. Then schedule a command with and without ->onOneServer() and count how many times it runs.
This is part of my daily System Design Drills series.
Comments
Join the discussionOne check before the third server goes live: add up the database connections each box will open. Three servers with their usual worker pools can hit MySQL's limit together, even when traffic looks fine.
Good point Rishabh, a third box quietly multiplies the open connections, so it's worth checking pool sizes against MySQL's max_connections before it goes live instead of finding out during a sale.
Exactly, that pool-size check is easy to miss. Sizing each instance's pool so the three together stay under max_connections, then load-testing that total before the sale window, would catch it early.
Exactly Rishabh, sizing the pools on paper is only half of it, and a load test at the combined total before the sale window is what actually proves the numbers hold.
Agreed, the load test is what turns the math into proof. Watching pool wait time during that run is useful too, since it usually rises before connections are actually refused.
Good call Rishabh, pool wait time is the early warning. If it starts climbing during the load test you know you're near the limit well before anything actually gets refused.
Exactly, that early climb is the useful signal. Logging wait time alongside active connections during the test would make the limit much easier to spot before the sale.
Good idea Rishabh, putting wait time and active connections on the same graph makes it obvious where things start to bend, so the limit is easy to read off well before sale day.
That shared graph helps, especially before sale day. One addition I would make is marking the pool limit on it, so the bend reads as distance to the limit, not just a rising line.
Marking the limit on the graph is a great touch Rishabh. Then anyone looking at it can see how much headroom is left instead of guessing from the slope.
Exactly, headroom is easier to act on than a slope. I would also show it as a percentage of the limit, so a quick glance tells you how close you are. That makes the decision to add capacity before sale day much clearer.
Yes, headroom as a percentage of the pool limit is the one I'd put at the top of the dashboard. If it's sitting at 85% a week before the sale, the capacity call pretty much makes itself.
That 85% rule is a clean trigger, since it leaves room to act before the sale rush. I would pair it with a short alert window, so a brief spike does not force a capacity change on its own.
Good call Rishabh, requiring it to stay above 85% for a few minutes filters out a one off spike, so you only add capacity when the load is real.
Exactly, that sustained window is the key part. I would also log how long it stays above 85%, so you can tell a steady climb from a short burst before adding capacity.
Logging the duration is a nice touch, it also gives you real numbers later to tune that window instead of guessing.
Agreed, those logged durations make the window easy to tune later. I would also note the traffic level at each peak, so you can tell a real surge from a slow background job.
Good point Rishabh, having the request rate next to each peak makes it obvious whether it was real users or just a heavy job running in the background.
Exactly, that pairing makes each peak easy to read at a glance. Logging the endpoint or job name alongside it would make a surge traceable without digging through separate logs.
Tagging each peak with the endpoint or job name is a great idea, then the graph points you straight at the culprit instead of sending you off to search through logs.
Exactly, that is the payoff. Keeping the tag set short also helps, so a peak reads as one cause instead of several similar labels.
Agreed, a short tag list keeps the graph readable, otherwise you end up with five labels that all point at the same slow job.
Exactly. A shared list of allowed tags helps too, so similar jobs do not drift into separate labels as new endpoints are added.
Good point Rishabh, a shared list of allowed tags stops "report-export" and "export-report" from showing up as two different causes. A short convention doc next to the dashboard would keep it from drifting.
That convention doc is a good next step. I would keep it to one short page, with the allowed tags and one example each, so new jobs do not quietly add a variant.
One short page with an example per tag is the right size, Rishabh. If it gets longer than that nobody reads it before adding a new job anyway.
Exactly, Anish. Reviewing any new tag in the same pull request that adds the job would keep that short page enforced, so a variant cannot slip in unnoticed.
Making the tag part of the same PR review is a nice touch, Rishabh. The reviewer already has the job open, so checking it against the page costs almost nothing.
That is the real win, Anish. Checking the tag in the same diff catches a mismatch before it ships. Keeping the page to one example per tag also keeps that check quick as more jobs are added.
Exactly, catching it in the diff is way cheaper than cleaning up a messy dashboard a month later. Thanks for all the ideas in this thread, Rishabh.
Thanks, Anish. That diff check stays valuable only if the dashboard stays clean as more jobs are added, so keeping one example per tag is a good guardrail.
Fully agree, Rishabh. Keeping that tag page small is what makes the review check stick as the job list grows.
Exactly, and a small page also makes the check quick to run before each deploy. Keeping one example per tag should stop it from growing back quietly.
Right, if the check only takes a minute people actually run it before a deploy instead of skipping it when they are in a hurry.
That is the real test for it. A check people skip under pressure is not a gate, even if it is thorough on paper. Keeping it to one minute is what makes it survive a busy deploy day.
Well put, Rishabh. A gate that gets skipped on a busy deploy day is really just documentation, so keeping it quick matters more than making it exhaustive.
Agreed. I would frame it as a trade-off, not a shortcut: a one-minute gate that always runs beats a thorough one that gets skipped. The fast check should cover the failure that would hurt most, and the rest can live in a slower review.
That's a good way to split it, Rishabh. Put the failure that would hurt most in the fast check and let the slower review catch everything else.
Exactly. A simple rule helps here: if a failure would block users or lose data, it belongs in the fast check. Everything else can wait for the slower review.
That rule keeps the fast check honest, Rishabh. If a failure can block a checkout or lose data it runs on every change, and the rest can wait for the slower pass.
Exactly, that split keeps the fast check trustworthy. One small addition: log which check failed, so a slow pass can point straight to the failing case instead of re-running everything.
Logging which check failed is a small change that saves a lot of time, Rishabh. A slow run then tells you exactly where to look instead of making you rerun the whole suite.
Exactly, and naming the failed check in the log line itself is the part that pays off. When a run goes slow, you can see which step stalled without rerunning everything.
Right, once the check name is in the log line nobody has to dig for it. It also makes patterns jump out when the same step keeps stalling across runs.
That pattern point is worth acting on. Counting failures by check name would show whether one step stalls repeatedly or many steps stall once, and each points to a different fix.
A small weekly check on that count would close the loop: if one check keeps topping the list, that is the step to fix first, rather than treating every failure as a one-off.
Counting by check name is the right next step, Rishabh. Then you can tell a single sticky failure from a scatter of one-offs and fix the right thing first.
A weekly look at that count is a nice habit, Rishabh. Whatever keeps landing at the top of the list is the obvious thing to fix next.
Exactly — once the counts are per check, the list does the prioritising for you. The only trap I'd watch for is a check that keeps topping the list because the check itself is flaky, not the thing it tests.
Good catch on the flaky-check trap, Rishabh. If the check itself is noisy it will keep topping that list and you end up chasing the wrong problem.
Exactly — the fix I'd try first is a short retry or a second confirmation run before a check counts toward the list, so one noisy probe can't stay on top. That keeps the weekly list pointing at real problems instead of the check itself.
The rolling-deploy exercise would be even stronger with a checkout running while old and new application versions overlap. Database compatibility is one boundary; session payloads and queued-job formats are two more. Testing that mixed-version window makes “any server can handle any request” a property of the release process as well as the steady state.
Agreed Mahdi, the article only covers backward-compatible migrations, but session payloads and queued jobs cross that old and new window too. Running a real checkout through a half-rolled deploy is a nice way to prove it.
One gotcha I'd add from a rollout like this: when you sync APP_KEY across the new boxes, every existing encrypted cookie dies at the same moment. We watched a chunk of users get bounced mid session during the cutover. If you're on Laravel 11, APP_PREVIOUS_KEYS lets you rotate instead of flipping the switch, so old cookies keep decrypting until they expire naturally. Worth calling out before the big sale, not after.
Good catch Kamran, a hard APP_KEY swap logging everyone out in the middle of a sale is a painful way to learn that. Rotating with APP_PREVIOUS_KEYS so old cookies keep decrypting is the much safer move.
One crash fixture I would add: a worker sends the report email, then dies before recording completion. A scheduler lock stops concurrent starts, but a retry can still repeat that external side effect. Keep the same report/run ID on retry and test the provider's duplicate handling, where supported. Where it cannot deduplicate, record that remaining risk. Would you include that crash point in the Day 3/Day 5 exercise?
Yes Arnold, that crash point is worth adding, since the scheduler lock only stops two runs starting together and does nothing about a retry repeating the send. Reusing the same run ID and checking it before sending covers most of it, and where the provider can't dedupe you just note the leftover risk.
The readiness-vs-liveness split is the detail most first-time setups get wrong: folding Redis into readiness means one cache blip pulls every server out of rotation at once. The duplicate report email is the other classic: a scheduled job needs a single owner the moment more than one box exists.
Thanks Abhinav, keeping Redis out of readiness is exactly what stops one cache blip from emptying the whole pool. And the duplicate report email is the bug that only shows up the day you add a second server 🙂